Web-based community tools for gathering feedback from end-users of remote sensing data. The tools are designed to assess usage patterns, evaluate data effectiveness, determine future imagery requirements, and promote greater use of remote sensing information at the community level.
The project is a collaboration between Stanford University, Centro Internacional de Mejoramiento de Maíz y Trigo (CIMMYT), and the local farmer union (Patronato) who has funded the website creation.
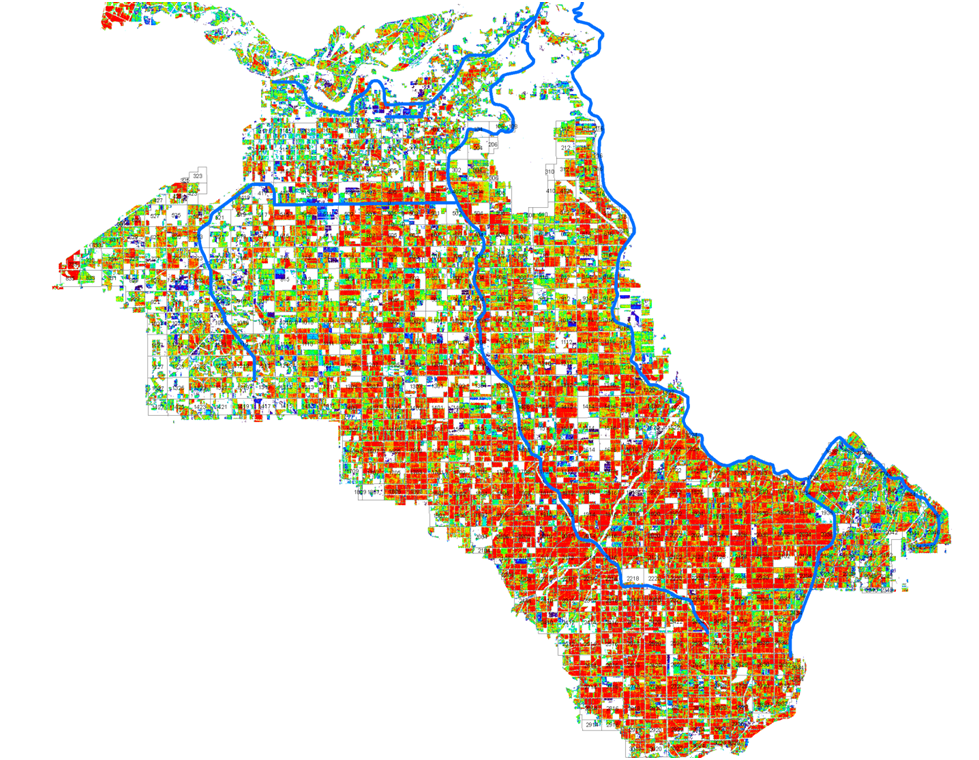
The Yaqui Valley of Northwest Mexico is one of the most intensive wheat producing regions in the world, with high fertilizer and irrigation inputs and high yields. In this project, high resolution (30m) satellite data are used to estimate wheat yields each year since 2000. Yield maps for individual years have been provided to 20+ farmers in the region, and maps of average yields are now being distributed on a website (http://www.pieaes.org.mx/). Some farmers already report using these images to tailor management inputs, and to evaluate the quality of different pieces of land. The web query attempts to retrieve information on farmer practices and field history, as a way of improving datasets for scientific inquiry. Other interested users include local water managers and the Sonoran agricultural agency. The goals of the project are to (1) identify what (if any) aspects of remote sensing data are of direct interest and use to land managers, and what specific changes they make as a result of using data; (2) leverage farmers’ interest in imagery to obtain more information on their fields and practices, as a way of validating remote sensing products and furthering scientific research.
To be posted when available.
| Project Lead | David Lobell (dlobell@stanford.edu) |
| Image Samples | http://www.pieaes.org.mx/rendimiento |
Map of wheat yields in the Yaqui Valley for 2007-08 growing season, inferred from Landsat satellite data. Red shows areas with high yields, blue with lower yields.